Time to Read 2 min
All devices and equipment must pass the oldest EMC standard which is the flicker-test. This standard defines how an equipment is allowed to draw power from the network without generating voltage fluctuations which would disturb lightning.
In most modern devices flicker is controlled by software (e.g. switching on and off of a heater), also hardware can be affected, e.g. if performance specification and flicker standard can only be reached through optimization of the form of the switching transient.
Which are the Problems?
Late discovery: In most cases the non-compliance is discovered only when hardware and software prototypes are available, in the worst case only at the compliance measurements.
Complexity: The flicker-measurement is highly non-linear and rather difficult to understand.
Possible Solutions
One can trust ones luck and wait until hard- and software are ready.
A certain overview is achievable by using the approximation formula and curves from the standard.
Simulation of Flicker Measurement
A much more exact prediction is available through the simulation of the flicker measurement, i.e. of a flickermeter according IEC 61000-4-15.
With this approach, the input data can be measured or simulated results from control system simulation and software development or from measurements on prototypes and rapid prototypes on one hand.
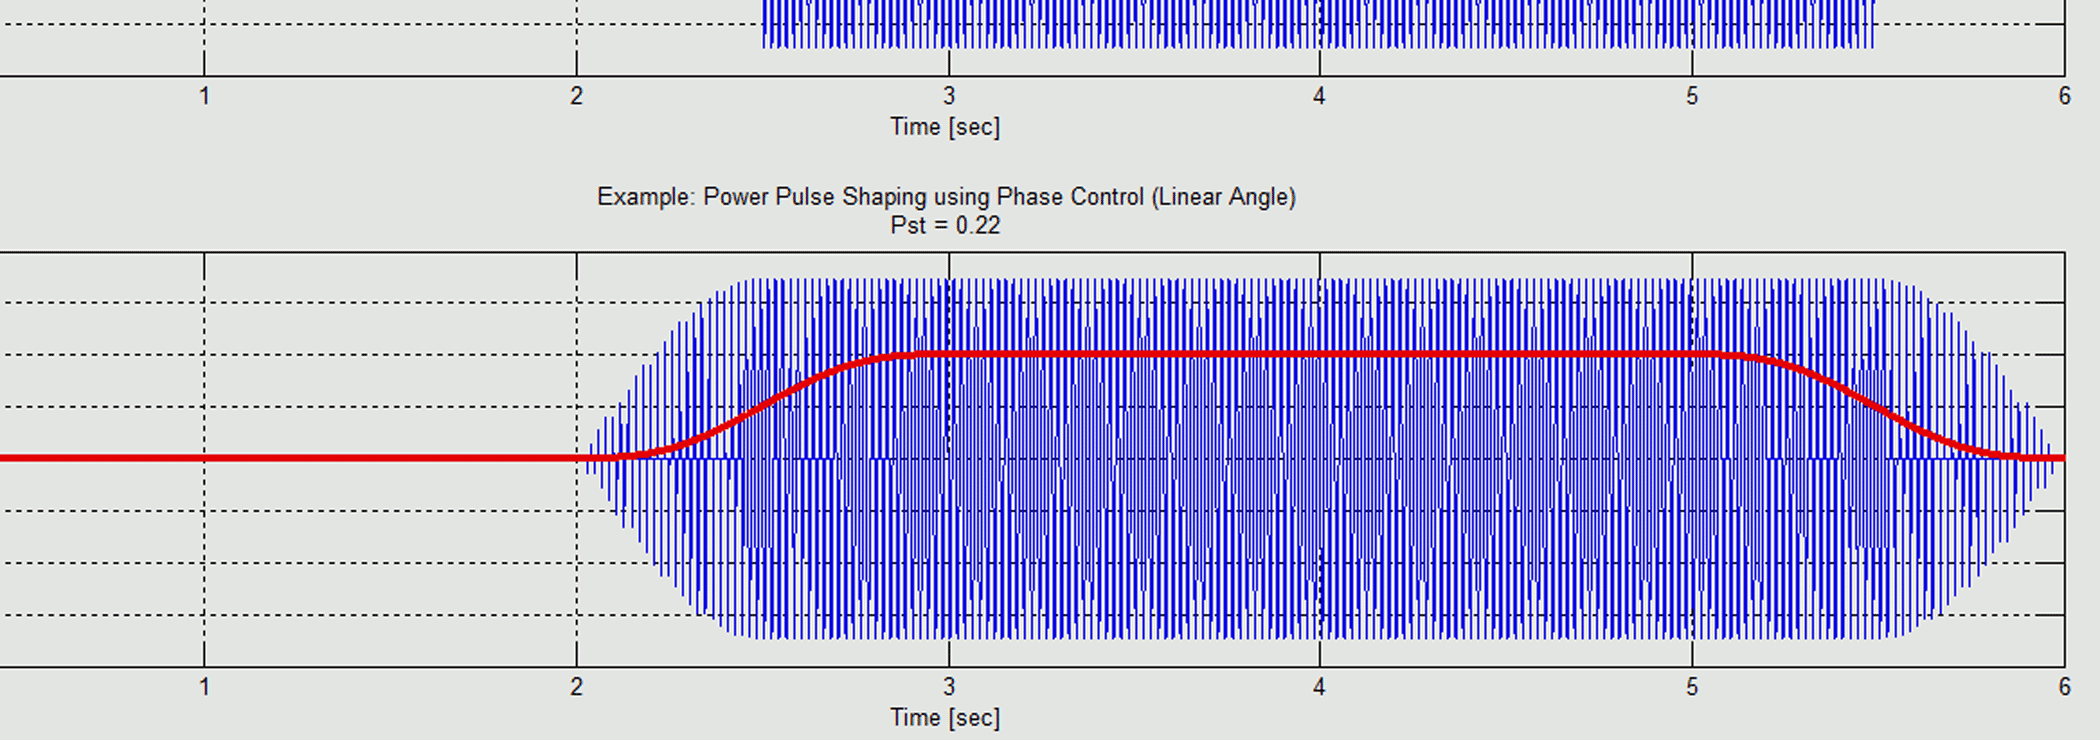
On the other hand generic generic waveforms (rectangle, trapezoidal,...) can be simulated.
The result is a first pass at the real flicker test.
Solcept Open Source Flicker Measurement-Simulator
Solcept has developed a flicker-measurement simulator and provides it here as open source under the Boost license.
The simulator runs on MathWorks MATLAB or the open source tool Octave.
It resulted in the same values as the measurement with real software and electronics for a 2.5 kW heater control system!
Download and Use
The simulator can be obtained for download below. If no MATLAB is available, Octave must be installed first.
In addition on this site more information about flicker for developers plus three application examples:
- Simulation of different waveforms
- Simulation with real measured data
- Simulation of the "selftest" of the standard IEC 61000-4-15
If you click on the download link below, you accept the following conditions of use:
- The program is provided "as is" without any warranty.
- The program is distributed under the Boost Lizenz.
Use this link or follow the Download Link on Matlab Central.
Quick Reference
- Copy content of Zip-file to a suitable directory
- Start MATLAB or Octave
- Chang to the directory containing the extracted data (e.g. 'd:\data\flicker_sim\')
- Execute example (e.g. example_heater)
Patrik Jourdan
Do you have additional questions? Do you have feedback or improvements? If so, email me or comment your thoughts below!
Author

is Dipl. Elektroingenieur ETHZ, software developer and co-owner of Solcept. He develops embedded software with a focus on digital signal processing and sophisticated algorithms. Clean and reliable technical results are important to Patrik. He likes to spend his free time in nature, be it on foot or on his bike.
| Søren Vejlgaard Vedstesen
There is an error in the file examples_testbench_50Hz.m
The following lines:
% magnitude of relative voltage changes in percent
d = [2.715, 2.191, 1.450, 0.894, 0.722, 0.407, 2.343; % 120 V
3.178, 2.561, 1.694, 1.045, 0.844, 0.545, 3.426]; % 230 V
Should be:
% magnitude of relative voltage changes in percent
d = [2.715, 2.191, 1.450, 0.894, 0.722, 0.407, 2.343; % 230 V @ 50Hz
3.178, 2.561, 1.694, 1.045, 0.844, 0.545, 3.426]; % 120 V @ 50Hz
According to the standard 61000-4-15 table 5
The rest of the code holds true!
Best regards
Søren V.
p.jourdan@solcept.ch
You are right, the comments of these two lines are mixed up.
Thank you for discovering and reporting this error.
| Vance Campbell
It isn't clear to me how to create my own data matrix, either with simulated data or real measurements. Is there more information available?
Thank you
Andreas Stucki
Have a look at the examples ("example_*"), they show you how the data is generated, respectively what is the format required by the simulator.